COMPETITIVE COMPASS FOR THE HIGHER EDUCATION LMS MARKET
Learning Management Systems (LMS) serve as core digital infrastructure for managing instructional delivery, communication, assessment, and academic administration. They enable faculty to design and deploy course content, facilitate student interaction, automate grading, and support personalized learning through integrated analytics. These systems also handle critical operational functions such as enrollment tracking, course scheduling, and compliance reporting, and are typically integrated with systems like Student Information Systems (SIS) and identity management solutions.
ListEdTech’s Competitive Compass provides data-backed insights into LMS vendor positioning, informed by real adoption patterns across thousands of institutions. Designed for CIOs, academic technologists, and procurement teams, this resource goes beyond anecdotal evidence—helping decision-makers benchmark options, anticipate shifts, and make confident, strategic choices grounded in sector-wide trends.
EXECUTIVE SUMMARY
- Market Consolidation: Canvas (Instructure), Brightspace (D2L), Blackboard (Anthology), and Moodle now account for over 84% of higher education LMS implementations in North America, significantly reducing space for smaller vendors.
- Canvas Leadership: Canvas maintains a dominant market position, fueled by sustained product innovation and strategic backing from private equity firm KKR.
- AI & Automation: Leading platforms are prioritizing AI-powered features to drive instructional efficiency, personalized learning, and data-informed decision-making—while introducing new policy and training demands.
- System-Wide Migrations: Large-scale institutional shifts are reshaping market dynamics, with Brightspace and Canvas benefiting most from university system adoptions.
- Brightspace Momentum: Brightspace is gaining ground through targeted acquisitions, usability improvements, and wins among large institutions.
- Vendor M&A Activity: Mergers and acquisitions are intensifying, fostering innovation while concentrating market control and raising barriers to entry for emerging providers.
COMPETITIVE COMPASS
What the Competitive Compass tells about the current trends in the North American Higher Education LMS market:
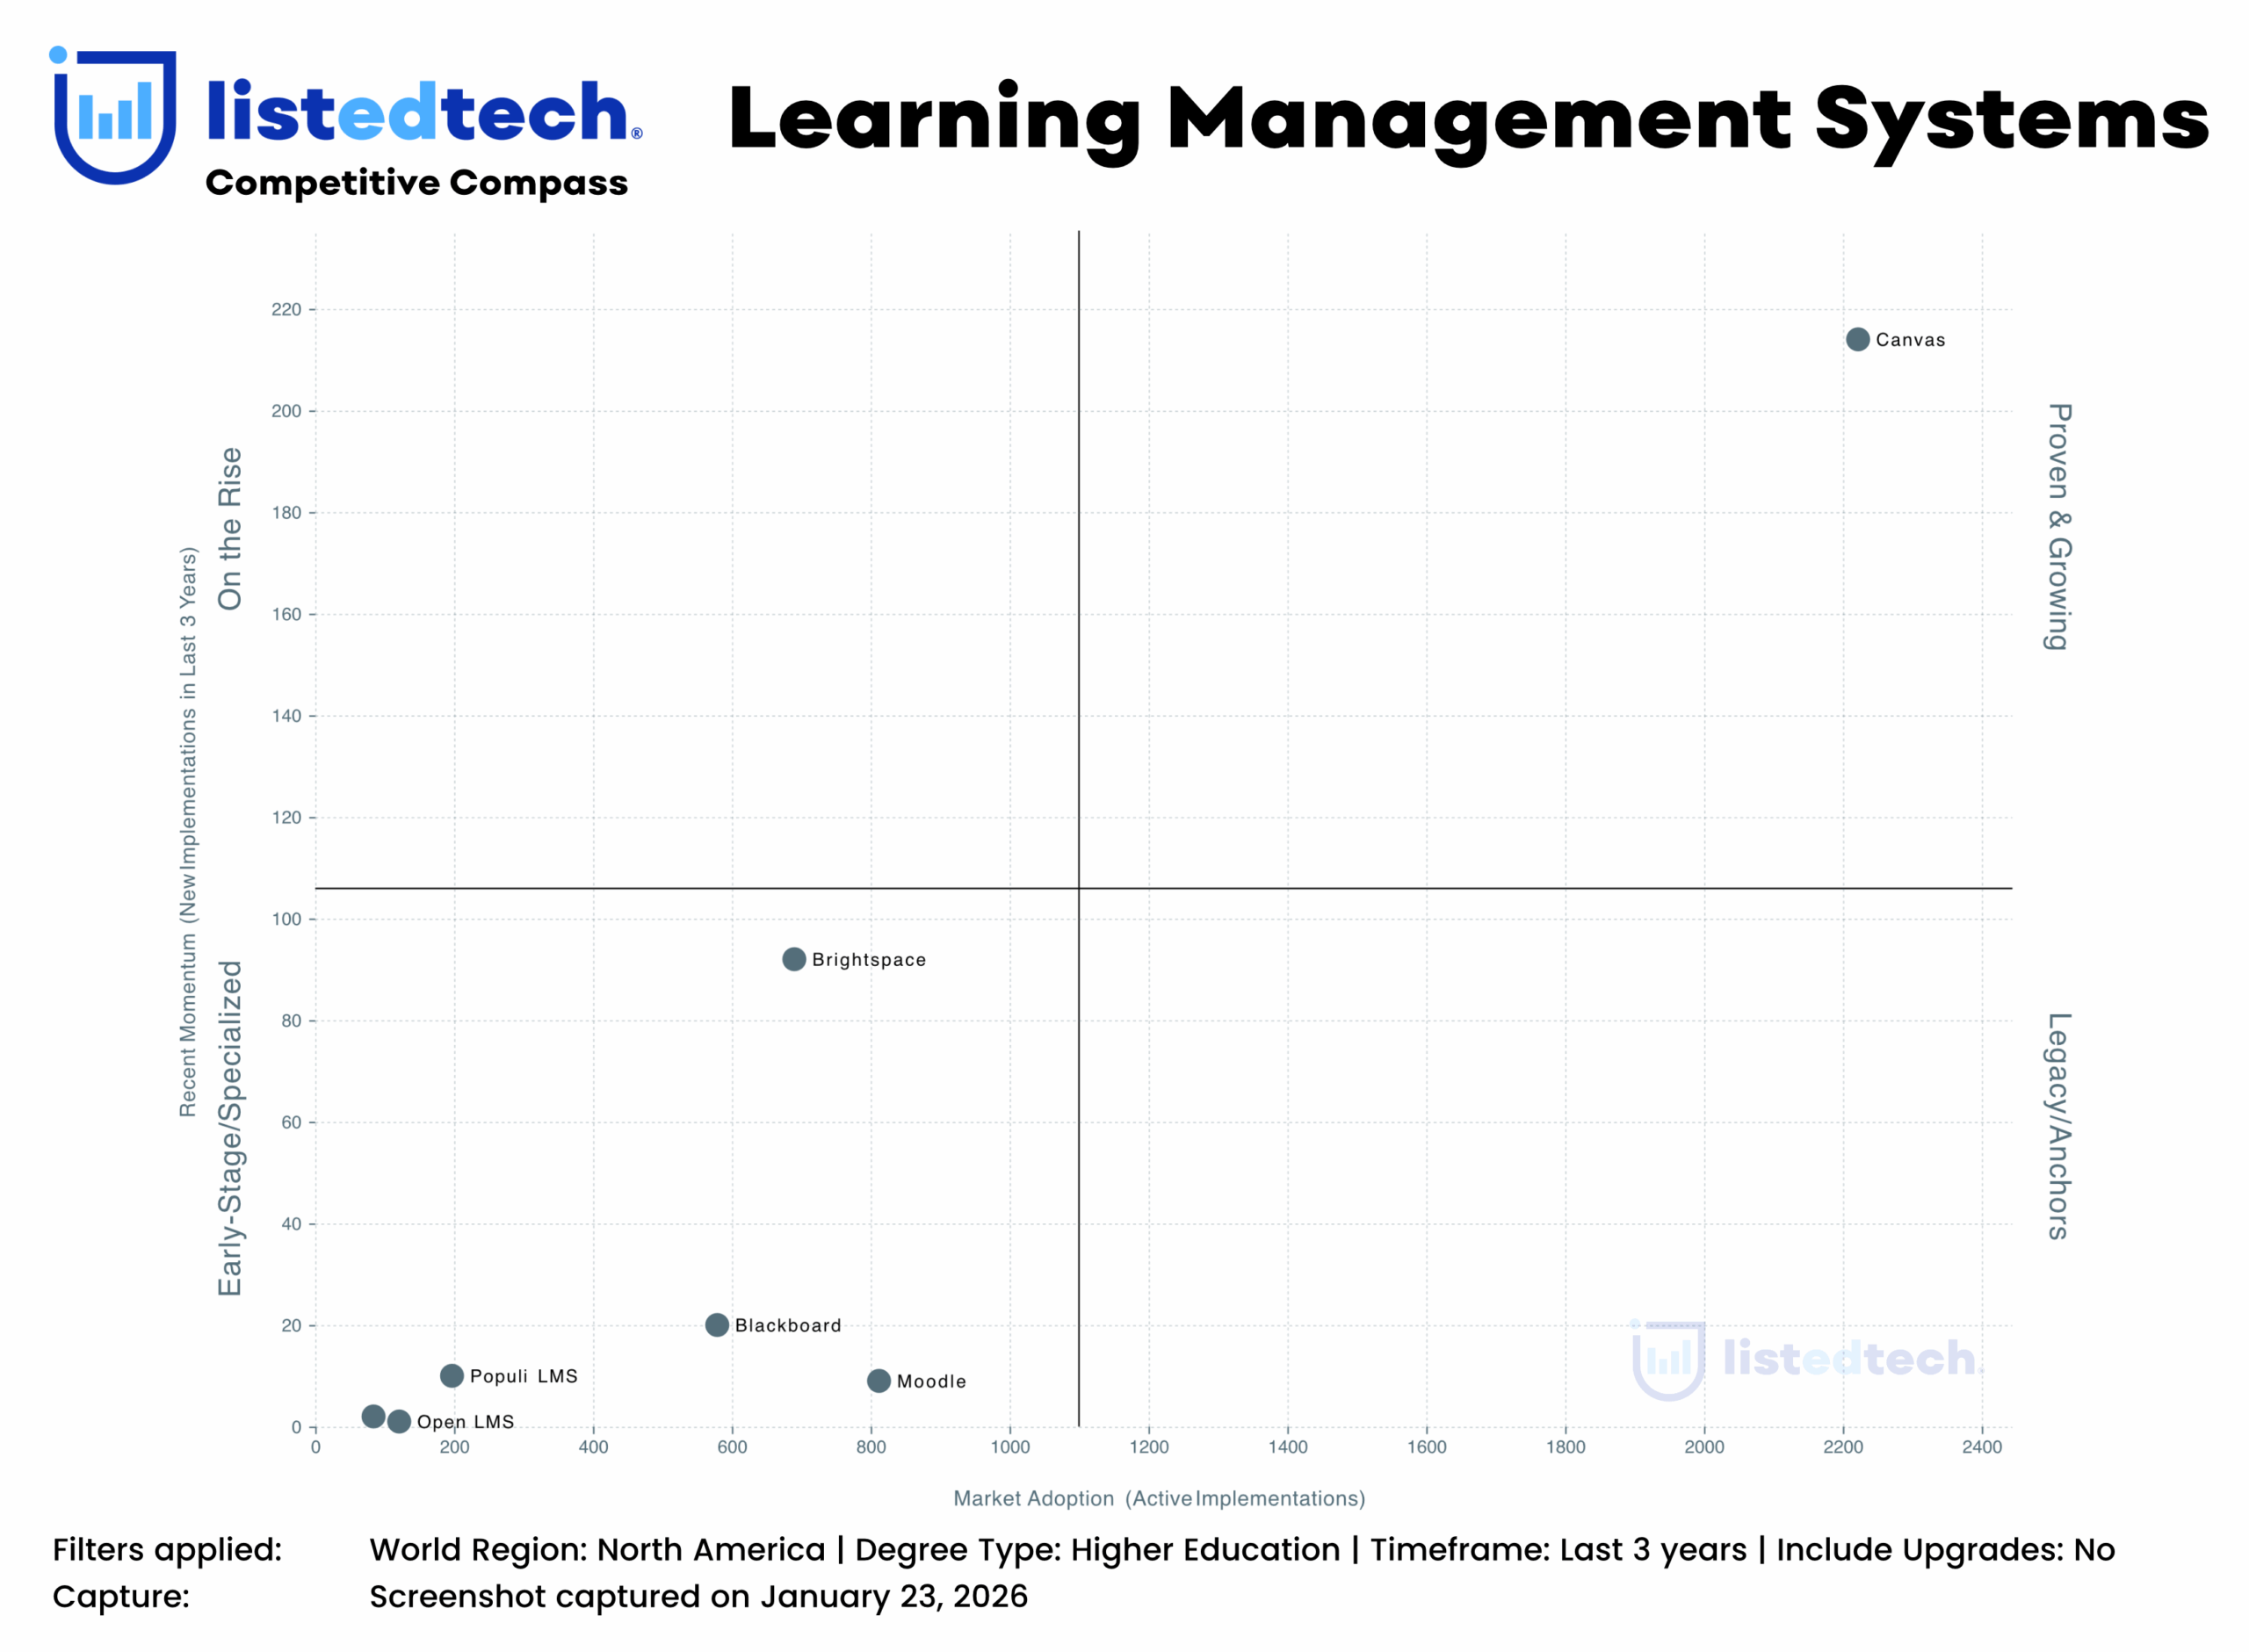
- Canvas leads the ‘Proven & Growing’ quadrant with the highest number of active and recent implementations, reflecting strong market dominance and sustained growth.
- Brightspace is at the edge of the ‘On the Rise’ quadrant, showing a balance of existing use and recent adoption, signaling increasing market traction, while
- Moodle maintains a large installed base but shows limited recent growth, placing it in the ‘Early-Stage / Specialized’ quadrant.
- Populi LMS, Open LMS, Schoology LMS, Google Classroom, Sakai, and Agilix Buzz all appear in the ‘Early-Stage / Specialized’ quadrant, characterized by lower levels of both active and recent use.
- Sakai is the only platform with zero recent implementations, indicating no new adoption despite its modest installed base.
STRATEGIC MARKET TRENDS
1. TOP FOUR VENDORS CEMENT MARKET CONTROL
Chart insights confirm that Canvas by Instructure is the undisputed market leader, holding approximately 43% market share and enjoying a substantial lead over other vendors. The next three—Moodle, Brightspace, and Blackboard—each control between 12% and 16%, forming a competitive second tier. There is a precipitous drop in market share beyond these four, with all remaining vendors individually holding less than 4%, and the collective ‘Others’ category now accounting for just 3.4%.
Historical data underscores a decade-long consolidation trend: the top four vendors have steadily increased their combined market share, while smaller competitors and open-source alternatives have lost ground. This has produced a less fragmented, more stable market, restricting new entrants and concentrating innovation, pricing power, and institutional relationships among a select few.
Low fragmentation and the dominance of these players mean that institutions seeking to migrate or deploy new systems are overwhelmingly choosing among these four. The market’s stability is both a sign of vendor strength and a potential barrier to disruptive innovation from outside the top tier.
2. CANVAS EXTENDS ITS LEAD AMID PRIVATE EQUITY BACKING
Canvas’s market share has risen dramatically over the past decade, growing from 13% in 2015 to more than 41% in 2024, making it the clear market leader. Its momentum is evidenced by the highest number of active and recent implementations, cementing its role as the platform of choice for many institutions.
The 2024 acquisition of Instructure by private equity firm KKR (valued at $4.8 billion) marks a significant shift. This move is positioned to fund further product innovation, expand global reach, and accelerate revenue growth, with KKR providing both capital and strategic expertise. The stated goal is to scale Canvas’s capabilities and maintain its leadership position in the face of evolving institutional needs.
Canvas’s dominance and the influx of private equity resources are likely to intensify competition and drive continued product enhancements, positioning it for sustained leadership in the near term.
3. MERGERS & ACQUISITIONS REDEFINE LMS MARKET STRUCTURE
Recent years have seen a marked uptick in high-value EdTech transactions, with private equity and strategic buyers targeting established LMS vendors and adjacent technology providers. Instructure’s $4.8 billion buyout by KKR and Dragoneer exemplifies investor confidence and provides new resources for product development and growth. D2L’s acquisition of H5P strengthens Brightspace’s interactive content capabilities, while other sector deals (e.g., Cengage Group, Newsela, and PowerSchool) demonstrate a pattern of consolidation and portfolio expansion.
These M&A activities are not limited to the largest vendors; niche and mid-market players are also being acquired, integrated, or repositioned, further accelerating industry consolidation. The strategic rationale centers on scaling operations, broadening product suites, and leveraging synergies to deliver more comprehensive solutions.
ABOUT LISTEDTECH’S COMPETITIVE COMPASS
The Competitive Compass is a strategic visualization, developed by ListEdTech, to help stakeholders quickly understand vendor positioning across two critical market signals:
- Market Adoption (X-axis): The number of active implementations — representing current presence in the field.
- Recent Momentum (Y-axis): The number of new implementations in the past 5 years — indicating growth trajectory.
By plotting vendors across these axes, the Compass reveals strategic positioning: which companies are expanding, stable, or emerging.
Quadrant Definitions
| Quadrant Name | Description |
|---|---|
| Proven & Growing | Vendors with both widespread adoption and strong recent growth. These are category leaders maintaining upward momentum. |
| On the Rise | High recent growth but lower total market share. Often newer entrants or fast-moving disruptors. |
| Legacy Anchors | Strong adoption but limited recent growth. Longtime incumbents that may face saturation or declining market activity. |
| Early-Stage / Specialized | Lower adoption and momentum. May represent niche solutions, new entrants, or regionally focused tools. |
Central Lines: How We Define the Midpoints
To ensure meaningful segmentation, we place central X and Y lines that split the Compass into four quadrants:
- The vertical line (X midpoint) is set at half of the highest value on the Market Adoption axis.
- The horizontal line (Y midpoint) is set at half of the highest value on the Recent Momentum axis.
This method dynamically adjusts for each product category, enabling a consistent and comparative interpretation across systems and filters.
- Vendors to the right of the vertical line exceed the market median for active use.
- Vendors above the horizontal line exceed the market median for momentum.
Available Filters for the Competitive Compass on the ListEdTech Portal
This is where the power of the Competitive Compass becomes truly clear.
In our portal, you can apply filters to explore product adoption and momentum within specific market segments, based on:
- World Regions (North America, Europe, Asia, etc.)
- Public / Private Institutions
- Degree Type Offered (2-year, 4-year, etc.)
- Student Enrollment Size
- Include Upgrades (to factor in recent system switches)
Understanding Upgrades in the Available Filters
What Counts as an Upgrade?
An upgrade occurs when an institution moves to a newer version or a different product from the same vendor within the same product category. This is different from switching to a new vendor; the institution stays in the same ecosystem but adopts a more modern offering.
ABOUT LISTEDTECH
ListEdTech is a market research firm specializing in the tracking of educational technology systems across the education sector. Our mission is to support colleges, universities, consultants, and education-focused companies by providing comprehensive data insights to enhance understanding of the EdTech market.
Since its launch in August 2021, the ListEdTech portal has offered organizations and institutions access to a robust database encompassing both granular microdata and broad macro trends related to institutional product implementations. The portal provides detailed information on implementation timeframes, historical market shares, product replacements, and active client counts segmented by enrollment size. Users have access to data spanning over 30 distinct product categories, enabling informed decision-making and strategic planning within the education technology landscape.
Methodology
ListEdTech collects data through systematic scanning of publicly available sources, including news releases, social media platforms, and official websites of universities and companies. Our dataset captures a broad range of information, including but not limited to:
- Educational companies, products, and institutional characteristics
- Primary and secondary systems supported by an institution
- Implementation and decommission dates
- Contracts, requests for proposals (RFPs), and acquisition details
To ensure data integrity and reduce bias, our team conducts regular updates, reviews, and validations directly at the source. This rigorous process enables us to organize, classify, and maintain a database containing over 3.5 million data points. While absolute market representation cannot be guaranteed, our methodology is designed to prevent over-representation of any single solution. As part of our ongoing quality control measures, we perform monthly reviews of the database, consistently achieving an accuracy rate of approximately 95%.
READY TO NAVIGATE THE EDTECH MARKET WITH CONFIDENCE?
The Competitive Compass is more than just a visualization — it’s a tool designed to empower your decisions with real data, not assumptions. By highlighting both market adoption and recent momentum, and by allowing granular filtering, it offers a clear, tailored view of the EdTech landscape. Because in a complex market, clarity isn’t optional — it’s essential.
You can explore the Competitive Compass in the ListEdTech Portal — available for premium institution users and most company subscription plans. We’re gradually rolling out the Competitive Compass across product categories.